

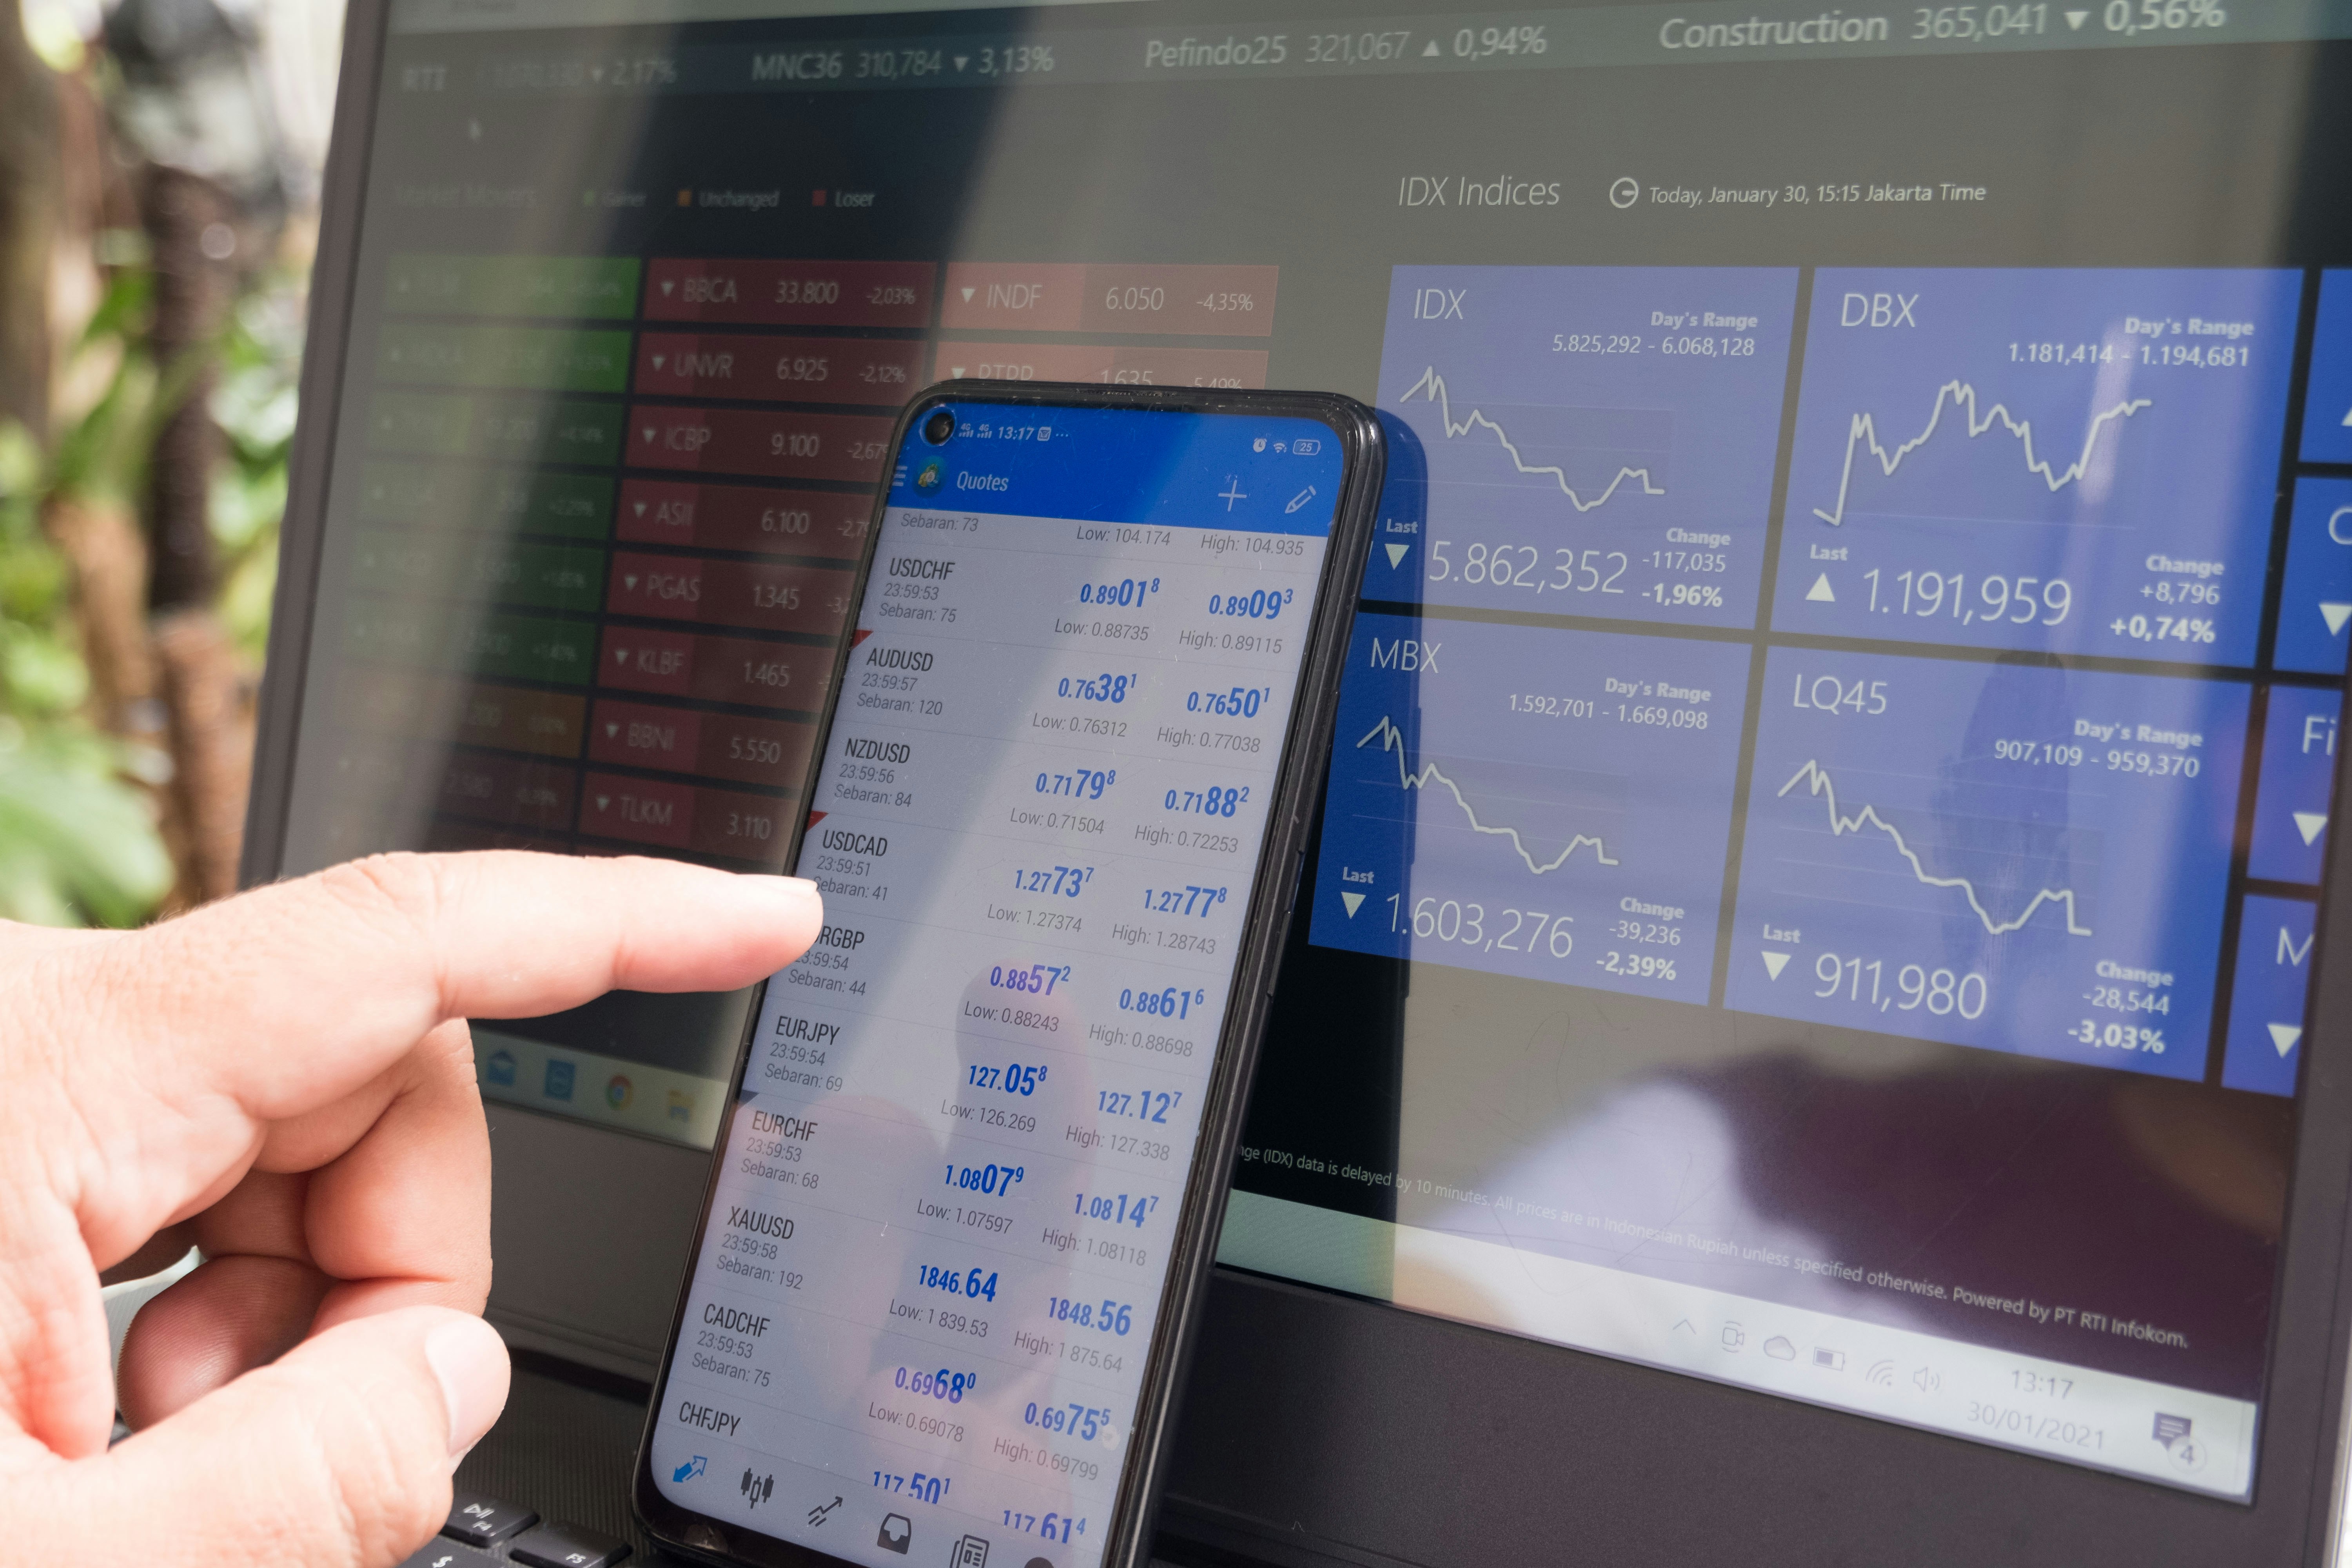
If you have spent any time around technical trading, you have probably wondered what is RSI and why so many traders keep it on their charts. RSI, short for Relative Strength Index, is a momentum indicator that measures the speed and size of recent price changes. It condenses that information into a single number between 0 and 100, giving a quick read on whether an asset has been pushed up or down sharply over a chosen lookback period. This guide explains how it works and how to use it thoughtfully.
What RSI measures
The Relative Strength Index compares the magnitude of recent gains to recent losses over a set number of periods and expresses the result on a scale from 0 to 100. When recent gains dominate, RSI moves toward the upper end of that scale; when recent losses dominate, it moves toward the lower end. In this way, RSI is not measuring price directly but the momentum behind price — how forcefully the market has been moving in one direction.
Because it is bounded between 0 and 100, RSI is easy to read at a glance and easy to compare across different assets and timeframes. A common convention treats readings above 70 as overbought and readings below 30 as oversold, though these thresholds are choices, not laws. The core idea is simply that very high readings reflect strong recent upside momentum, and very low readings reflect strong recent downside momentum. What you do with that information is where judgment comes in.
How to use RSI
The most familiar use of RSI is spotting overbought and oversold conditions. When RSI climbs into overbought territory, it signals that price has risen quickly and may be stretched; when it falls into oversold territory, it suggests the opposite. Some traders treat these as cues to fade the move, expecting a pause or reversal. Used this way, RSI becomes a rough gauge of when a short-term move may have run far enough to warrant caution.
A second common use is looking for divergence between RSI and price. If price makes a new high but RSI makes a lower high, the momentum behind the move may be fading even as price still climbs — a hint that the trend could be weakening. The reverse can appear at lows. Divergence is not a guarantee of anything, but it is one way traders use RSI to question whether a move has the force to continue. In both applications, RSI works best as one input among several, confirming or challenging a view rather than dictating it.
The limits of RSI
The biggest trap with RSI is treating overbought and oversold as automatic sell and buy signals. In a strong trend, RSI can remain overbought for a long time while price keeps climbing, and traders who short every high reading get run over. The same happens in reverse during sharp downtrends. An indicator built to flag stretched conditions can stay stretched far longer than seems reasonable, so an extreme reading is a reason to pay attention, not a reason to act blindly.